Edvancer's Knowledge Hub
How to evaluate a machine learning model- part 1

Evaluation metrics are co-related to machine learning tasks. The tasks of classification, regression, ranking, clustering, topic modeling, etc, all have different metrics. Some metrics, such as precision recall, are of use for multiple tasks. Classification, regression, and ranking are examples of supervised learning, which comprises a majority of machine learning applications. In this series, we’ll be focusing on the metrics for supervised learning modules.
Classification Metrics
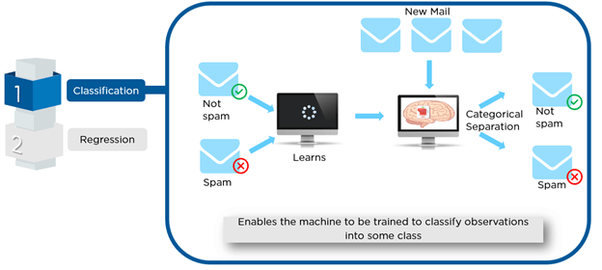
Classification is about predicting class labels based on input data. In binary classification, there are two possible classes of output, whereas in multiclass classification, there are more than two possible classes. Here, we’ll focus on binary classification, but all of these metrics can be extended to the multiclass scenario.
One example of binary classification is spam detection, where theinput data could include the email text and metadata (sender, sendingtime), and the output label is either “spam”or “not spam.” (See the figure below.) Sometimes, people use generic names for the two
Classes: “positive” and “negative,” or “class 1” and “class 0.”
Classification performance can be measured in a number of different ways.
Some of the most popular metrics are, accuracy, confusion matrix, log-loss, and AUC are Precision-recall is also used widely.
 Email spam detection is a binary classification problem.
Accuracy
Accuracy measures how often the classifier makes the correct prediction. It is measured by the ratio between the number of correct predictions and the total number of predictions (the number of data points in the test set):
Accuracy = #correct predictions/ #total data points
Confusion matrix
Though Accuracy seems easy, it makes no distinction between classes; correct answers for class 0 and class 1 are treated as the same. —Sometimes this is not enough. One might want to look at how many examples failed for class 0 versus class 1, because the cost of misclassification might differ for the two classes, or one might have a lot more test data for one class compared to that for the other. For example, consider two situations: One where a doctor diagnoses a patient with cancer when the patient does not have it (known as a false positive), and one where the patient actually has cancer but the doctor doesn’t declare so (a false negative). Both of these scenarios have completely different consequences.
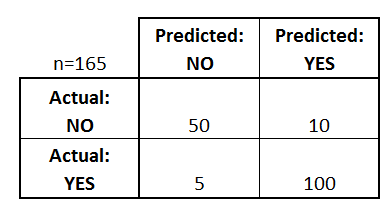
A confusion matrix (or confusion table) shows a more detailed breakdown of correct and incorrect classifications for each class. The rows of the matrix represent ground truth labels, while the columns correspond to the prediction.
Let’s start with an example of a confusion matrix for a binary classifier, which can easily be extended to the case of more than two classes:
Here is a list of rates that are often computed from a confusion matrix for a binary classifier:
Email spam detection is a binary classification problem.
Accuracy
Accuracy measures how often the classifier makes the correct prediction. It is measured by the ratio between the number of correct predictions and the total number of predictions (the number of data points in the test set):
Accuracy = #correct predictions/ #total data points
Confusion matrix
Though Accuracy seems easy, it makes no distinction between classes; correct answers for class 0 and class 1 are treated as the same. —Sometimes this is not enough. One might want to look at how many examples failed for class 0 versus class 1, because the cost of misclassification might differ for the two classes, or one might have a lot more test data for one class compared to that for the other. For example, consider two situations: One where a doctor diagnoses a patient with cancer when the patient does not have it (known as a false positive), and one where the patient actually has cancer but the doctor doesn’t declare so (a false negative). Both of these scenarios have completely different consequences.
A confusion matrix (or confusion table) shows a more detailed breakdown of correct and incorrect classifications for each class. The rows of the matrix represent ground truth labels, while the columns correspond to the prediction.
Let’s start with an example of a confusion matrix for a binary classifier, which can easily be extended to the case of more than two classes:
Here is a list of rates that are often computed from a confusion matrix for a binary classifier:

Share this on
Follow us on
 Email spam detection is a binary classification problem.
Accuracy
Accuracy measures how often the classifier makes the correct prediction. It is measured by the ratio between the number of correct predictions and the total number of predictions (the number of data points in the test set):
Accuracy = #correct predictions/ #total data points
Confusion matrix
Though Accuracy seems easy, it makes no distinction between classes; correct answers for class 0 and class 1 are treated as the same. —Sometimes this is not enough. One might want to look at how many examples failed for class 0 versus class 1, because the cost of misclassification might differ for the two classes, or one might have a lot more test data for one class compared to that for the other. For example, consider two situations: One where a doctor diagnoses a patient with cancer when the patient does not have it (known as a false positive), and one where the patient actually has cancer but the doctor doesn’t declare so (a false negative). Both of these scenarios have completely different consequences.
A confusion matrix (or confusion table) shows a more detailed breakdown of correct and incorrect classifications for each class. The rows of the matrix represent ground truth labels, while the columns correspond to the prediction.
Let’s start with an example of a confusion matrix for a binary classifier, which can easily be extended to the case of more than two classes:
Email spam detection is a binary classification problem.
Accuracy
Accuracy measures how often the classifier makes the correct prediction. It is measured by the ratio between the number of correct predictions and the total number of predictions (the number of data points in the test set):
Accuracy = #correct predictions/ #total data points
Confusion matrix
Though Accuracy seems easy, it makes no distinction between classes; correct answers for class 0 and class 1 are treated as the same. —Sometimes this is not enough. One might want to look at how many examples failed for class 0 versus class 1, because the cost of misclassification might differ for the two classes, or one might have a lot more test data for one class compared to that for the other. For example, consider two situations: One where a doctor diagnoses a patient with cancer when the patient does not have it (known as a false positive), and one where the patient actually has cancer but the doctor doesn’t declare so (a false negative). Both of these scenarios have completely different consequences.
A confusion matrix (or confusion table) shows a more detailed breakdown of correct and incorrect classifications for each class. The rows of the matrix represent ground truth labels, while the columns correspond to the prediction.
Let’s start with an example of a confusion matrix for a binary classifier, which can easily be extended to the case of more than two classes:
 Here is a list of rates that are often computed from a confusion matrix for a binary classifier:
- Accuracy:Overall, how often is the classifier correct?
- (TP+TN)/total = (100+50)/165 = 0.91
- Misclassification Rate:Overall, how often is it wrong?
- (FP+FN)/total = (10+5)/165 = 0.09
- equivalent to 1 minus Accuracy
- also known as “Error Rate”
- True Positive Rate:When it’s actually yes, how often does it predict yes?
- TP/actual yes = 100/105 = 0.95
- also known as “Sensitivity” or “Recall”
- False Positive Rate:When it’s actually no, how often does it predict yes?
- FP/actual no = 10/60 = 0.17
- Specificity:When it’s actually no, how often does it predict no?
- TN/actual no = 50/60 = 0.83
- equivalent to 1 minus False Positive Rate
- Precision:When it predicts yes, how often is it correct?
- TP/predicted yes = 100/110 = 0.91
- Prevalence:How often does the yes condition actually occur in our sample?
- actual yes/total = 105/165 = 0.64
Manu Jeevan
Manu Jeevan is a self-taught data scientist and loves to explain data science concepts in simple terms. You can connect with him on LinkedIn, or email him at manu@bigdataexaminer.com.
Latest posts by Manu Jeevan (see all)
- Python IDEs for Data Science: Top 5 - January 19, 2019
- The 5 exciting machine learning, data science and big data trends for 2019 - January 19, 2019
- A/B Testing Made Simple – Part 2 - October 30, 2018
Follow us on
Free Data Science & AI Starter Course
