Edvancer's Knowledge Hub
How to quantify relationship between categorical and continuous variables

In the last blog, we discussed ways to get descriptive statistics for univariate continuous variables. If there are no outliers and the distribution is symmetric, the mean and standard deviation are excellent measures of central tendency and dispersion, whereas the median and IQR may be more appropriate if outliers or strong skewness is present.
In data analysis and modelling, we are mostly interested in understanding the relationship between two or more variables, and determine which variables are related in a predictive sense to a particular response variable. Measures of Association are used to quantify the relationship between two or more variables.
The method used to determine any association between variables would depend on the variable type. Data could be on an interval/ratio scale i.e. continuous, or at an ordinal/rank scale, or a nominal/categorical scale. Based on the type of data, the following methods of association could be used to determine the association and the strength of association between variables.
Pearson’s correlation coefficient measures the strength of the linear relationship between two variables on a continuous scale. For example, the relationship between height and weight of a person or price of a house to its area.
The correlation coefficient, r (rho), takes on the values of −1 through +1. Values of −1 or +1 indicate a perfect linear relationship between the two variables, and a value of 0 indicates no linear association. (There could be non-linear association).
A value between 0 and +1 means the variables are positively correlated i.e. increase in the value of one variable leads to an increase in another. For example, a house with more sqft would have a higher price.
A value between -1 and 0 means the variables are negative correlated i.e. increase in the value of one variable leads to decrease in another.
Any value that is not 0 or −1 or +1 indicate a linear relationship, although not a perfect linear relationship.
 Spearman rank-order correlation coefficient measures the measure of the strength and direction of association that exists between two variables. The test is used for either ordinal variables or for continuous data that has failed the assumptions necessary for conducting the Pearson’s product-moment correlation. For example, you could use a Spearman’s correlation to understand whether there is an association between exam performance and time spent revising; whether there is an association between depression and length of unemployment.
It is denoted by rs, can take values from +1 to -1. A rs of +1 indicates a perfect association of ranks, a rs of zero indicates no association between ranks and a rs of -1 indicates a perfect negative association of ranks. The closer rs is to zero, the weaker the association between the ranks.
Kendall’s tau-b (τb) correlation coefficient can also be used as an alternative to the Spearman rank-order correlation coefficient, especially when you have a small sample size with many tied ranks.
Point to note here is that all these coefficients measure of the strength of an association (specifically the linear relationship), they do not measure the significance of the association. The significance of an association is a separate analysis of the sample correlation coefficient, r, using a t-test to measure the difference between the observed r and the expected r under the null hypothesis.
Chi-Square test is used to determine the association between two categorical variables. The chi-square test, unlike Pearson’s correlation coefficient or Spearman rho, is a measure of the significance of the association rather than a measure of the strength of the association.
This test should be used to determine whether variables like education, political views and other preferences vary based on demographic factors like gender, race and religion. Or, to verify the influence of gender on purchase decisions and patterns.
The Chi-square test is based on hypothesis testing, and the hypothesis are defined as:
Null Hypothesis: There is no relationship between the two variables of interest.
Alternate Hypothesis: There is a significant relationship between the variables of interest.
The test involves comparing the observed frequencies of the variables to the expected frequencies which are calculated assuming the variables were independent of each other. If the p-value is less than the critical value, the test is significant. This means that there is an association between two variables. Otherwise, the test is nonsignificant and implies that there is not an association.
We summarized the Measures of Association here in this blog. In the next blog, we will talk about visualization techniques of descriptive statistics with python code.
References:
https://www.britannica.com/topic/measure-of-association
https://statistics.laerd.com/spss-tutorials/spearmans-rank-order-correlation-using-spss-statistics.php
Spearman rank-order correlation coefficient measures the measure of the strength and direction of association that exists between two variables. The test is used for either ordinal variables or for continuous data that has failed the assumptions necessary for conducting the Pearson’s product-moment correlation. For example, you could use a Spearman’s correlation to understand whether there is an association between exam performance and time spent revising; whether there is an association between depression and length of unemployment.
It is denoted by rs, can take values from +1 to -1. A rs of +1 indicates a perfect association of ranks, a rs of zero indicates no association between ranks and a rs of -1 indicates a perfect negative association of ranks. The closer rs is to zero, the weaker the association between the ranks.
Kendall’s tau-b (τb) correlation coefficient can also be used as an alternative to the Spearman rank-order correlation coefficient, especially when you have a small sample size with many tied ranks.
Point to note here is that all these coefficients measure of the strength of an association (specifically the linear relationship), they do not measure the significance of the association. The significance of an association is a separate analysis of the sample correlation coefficient, r, using a t-test to measure the difference between the observed r and the expected r under the null hypothesis.
Chi-Square test is used to determine the association between two categorical variables. The chi-square test, unlike Pearson’s correlation coefficient or Spearman rho, is a measure of the significance of the association rather than a measure of the strength of the association.
This test should be used to determine whether variables like education, political views and other preferences vary based on demographic factors like gender, race and religion. Or, to verify the influence of gender on purchase decisions and patterns.
The Chi-square test is based on hypothesis testing, and the hypothesis are defined as:
Null Hypothesis: There is no relationship between the two variables of interest.
Alternate Hypothesis: There is a significant relationship between the variables of interest.
The test involves comparing the observed frequencies of the variables to the expected frequencies which are calculated assuming the variables were independent of each other. If the p-value is less than the critical value, the test is significant. This means that there is an association between two variables. Otherwise, the test is nonsignificant and implies that there is not an association.
We summarized the Measures of Association here in this blog. In the next blog, we will talk about visualization techniques of descriptive statistics with python code.
References:
https://www.britannica.com/topic/measure-of-association
https://statistics.laerd.com/spss-tutorials/spearmans-rank-order-correlation-using-spss-statistics.php
Share this on
Follow us on
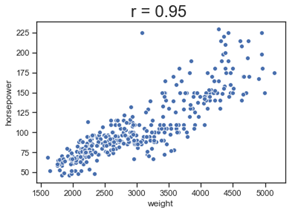
Figure 1: Positively Correlated: horsepower increases as the weight of the cars increases
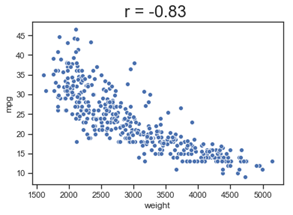
Figure 2: Negatively correlated: miles per gallon decreases as the weight of cars increases
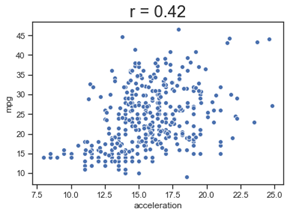
Figure 3: Weakly correlated: there seems to be a very weal correlation between mpg and acceleration
Latest posts by Yogita Kinha (see all)
- A simple guide to Hypothesis Testing - September 24, 2019
- Accelerate your job search with Word cloud in Python - September 22, 2019
- AI revolution in Healthcare industry - September 8, 2019
Follow us on
Free Data Science & AI Starter Course
