Edvancer's Knowledge Hub
DESCRIPTIVE STATISTICS FOR DATA SCIENCE? It’s Easy If You Do It Smart
So you have the business objective and you have painstakingly collected the data as well, now what? What to do with the data, how to understand the distribution of the target variable and how to analyse the influence or affect of other factors on the target?
The answer to this is Statistics. Statistics is a branch of applied mathematics that provides methods and tools to collect, analyse, present, and interpret data, and to make decisions.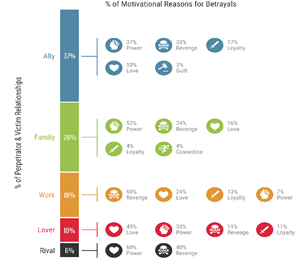 Statistics is about studying the data to get useful insights and making educated estimates about the population.
The picture on the right quantifies the motivational reasons for betrayals among allies, families, kingdoms, lovers and rivals in the most famous show of our times – GoT. Had Danaerys had this summary at her disposal, she would have known better to keep her allies under strict watch 😉
Statistics can be divided into two main areas: Descriptive Statistics and Inferential Statistics. Let’s understand the basics of data before diving deeper into descriptive and inferential statistics.
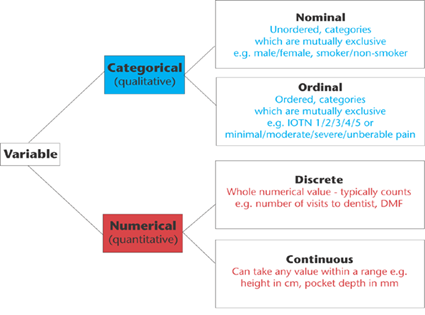
Variable Types: A data set is a collection of observations on one or more variables. For example, the height of all students in a class can be represented by the variable height and similar weight as weight variable. Depending on what type of data a variable holds, variables can be classified as in the picture below.
Statistics is about studying the data to get useful insights and making educated estimates about the population.
The picture on the right quantifies the motivational reasons for betrayals among allies, families, kingdoms, lovers and rivals in the most famous show of our times – GoT. Had Danaerys had this summary at her disposal, she would have known better to keep her allies under strict watch 😉
Statistics can be divided into two main areas: Descriptive Statistics and Inferential Statistics. Let’s understand the basics of data before diving deeper into descriptive and inferential statistics.
Variable Types: A data set is a collection of observations on one or more variables. For example, the height of all students in a class can be represented by the variable height and similar weight as weight variable. Depending on what type of data a variable holds, variables can be classified as in the picture below.
 Population and Sample
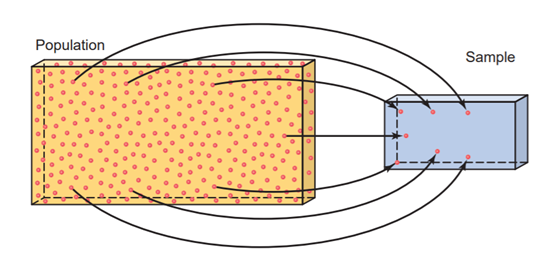
A population consists of all elements—individuals, items, or objects—whose characteristics are being studied. The population that is being studied is also called the target population. Since, most of the times, it is impossible or too expensive to get the data for the whole target population, a portion of the population is selected for study referred to as a sample. A sample is used to make inferences about the population behaviour.
Population and Sample
A population consists of all elements—individuals, items, or objects—whose characteristics are being studied. The population that is being studied is also called the target population. Since, most of the times, it is impossible or too expensive to get the data for the whole target population, a portion of the population is selected for study referred to as a sample. A sample is used to make inferences about the population behaviour.
 Now that we have an understanding of data and samples & population, how do we analyse the data and make it useful?
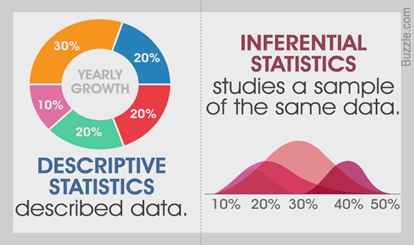
Here comes into picture the two areas of Statistics: Descriptive Statistics and Inferential Statistics
Descriptive statistics, as the name suggests, is used to display and describe data by using tables, graphs and summary measures. Inferential Statistics, on the other hand, pertains to studying a sample and use the results to make decisions or predictions about a population.
Now that we have an understanding of data and samples & population, how do we analyse the data and make it useful?
Here comes into picture the two areas of Statistics: Descriptive Statistics and Inferential Statistics
Descriptive statistics, as the name suggests, is used to display and describe data by using tables, graphs and summary measures. Inferential Statistics, on the other hand, pertains to studying a sample and use the results to make decisions or predictions about a population.
 In this article, we are going to focus on Descriptive Statistics and its various measures.
Descriptive Statistics and exploratory data analysis should be the first steps while building predictive or inference models. Descriptive statistics help understand large amounts of data by providing methods to summarise the data and retrieve information about the underlying structure of the data.
There are two ways to Descriptive statistics: Numerical and Graphical.
In this article, we are going to focus on Descriptive Statistics and its various measures.
Descriptive Statistics and exploratory data analysis should be the first steps while building predictive or inference models. Descriptive statistics help understand large amounts of data by providing methods to summarise the data and retrieve information about the underlying structure of the data.
There are two ways to Descriptive statistics: Numerical and Graphical.
| Numerical Methods | Graphical Methods |
| Measures of Central Tendency: Mean, Median and Mode | Univariate Data: Histograms, Pie chart, Bar Plots |
| Measures of Dispersion: Variance, Standard Deviation, Range, IQR | Bivariate Data: Boxplot, Scatterplot |
| Measures of Association: Chi-square and correlation | Multivariate Data: Biplots, Clustering |
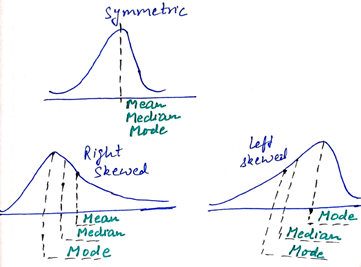 Measures of Central Tendency
Measures of Dispersion: Measures of central tendency do not give complete information about the distribution of type. They only provide the central value estimates but tell nothing about the variation in the data. The measures of central tendency and dispersion taken together give a better picture of a data set than the measures of central tendency alone.
Range is calculated as the difference between the largest value and the smallest value in the dataset. The range is the simplest measure but is quite sensitive to extreme values.
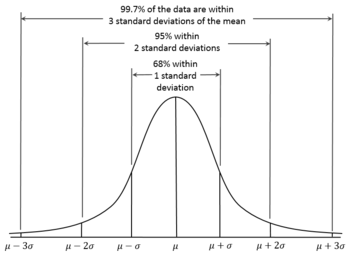
Variance and Standard Deviation are the most used measure of dispersion. Variance is calculated by taking the average of the squared differences between each value and the mean and Standard Deviation is equal to the square root of the variance. Standard Deviation is simply the standardised form of variance.
Standard Deviation tells about the spread of values around the mean. In general, a lower value of the standard deviation for a data set indicates that the values of that data set are spread over a relatively smaller range around the mean. While a larger value of the standard deviation for a data set indicates that the values of that data set are spread over a relatively larger range around the mean.
Measures of Central Tendency
Measures of Dispersion: Measures of central tendency do not give complete information about the distribution of type. They only provide the central value estimates but tell nothing about the variation in the data. The measures of central tendency and dispersion taken together give a better picture of a data set than the measures of central tendency alone.
Range is calculated as the difference between the largest value and the smallest value in the dataset. The range is the simplest measure but is quite sensitive to extreme values.
Variance and Standard Deviation are the most used measure of dispersion. Variance is calculated by taking the average of the squared differences between each value and the mean and Standard Deviation is equal to the square root of the variance. Standard Deviation is simply the standardised form of variance.
Standard Deviation tells about the spread of values around the mean. In general, a lower value of the standard deviation for a data set indicates that the values of that data set are spread over a relatively smaller range around the mean. While a larger value of the standard deviation for a data set indicates that the values of that data set are spread over a relatively larger range around the mean.
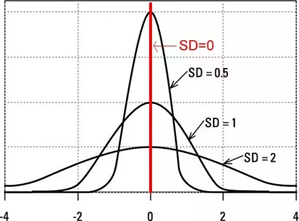
 Spread of Variance Standard Deviation and spread of data
Quartiles and Interquartile Range (IQR)
Quartiles divide a rank-ordered data set into four equal parts. Q1 represents the first quartile and is the
Spread of Variance Standard Deviation and spread of data
Quartiles and Interquartile Range (IQR)
Quartiles divide a rank-ordered data set into four equal parts. Q1 represents the first quartile and is the
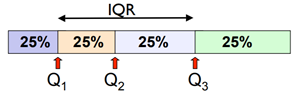 value for which 25% of the observations are smaller and 75% are larger. Q2 is the same as the median (50% are smaller, 50% are larger). Q3 is the third quartile and only 25% of the observations are greater than it.
IQR is equal to the difference between 75th and 25th percentiles, or between upper and lower quartiles, i.e. IQR = Q3 − Q1. IQR is used as a measure of dispersion for skewed data and to identify outliers. Upper outliers: Q3+1.5*IQR and Lower outliers: Q1–1.5*IQR.
Measures of Association indicate how two variables are associated with each other, if at all. The two commonly used approaches for testing this are Chi-Square and Correlation.
We will discuss these approaches of association and graphical methods of descriptive statistics in the upcoming blogs. Keep watching this space for more.
Hope you like the reads. Please share constructive feedback and topics that you would like to read about.
References
https://sciencestruck.com/descriptive-vs-inferential-statistics
https://www.nature.com/articles/6400501/figures/1
https://infograph.venngage.com/templates/infographics/statistical?preview=6dd8cb98-4a89-4a0a-9b65-5ba57eecd0b4
https://en.wikipedia.org/wiki/Normal_distribution
https://www.gs.washington.edu/academics/courses/akey/56008/lecture/lecture2.pdf
https://ia800608.us.archive.org/24/items/IntroductoryStatistics7thEdP.MannWiley2010WW/Introductory%20Statistics%207th%20ed%20-%20P.%20Mann%20%28Wiley%2C%202010%29%20WW.pdf
value for which 25% of the observations are smaller and 75% are larger. Q2 is the same as the median (50% are smaller, 50% are larger). Q3 is the third quartile and only 25% of the observations are greater than it.
IQR is equal to the difference between 75th and 25th percentiles, or between upper and lower quartiles, i.e. IQR = Q3 − Q1. IQR is used as a measure of dispersion for skewed data and to identify outliers. Upper outliers: Q3+1.5*IQR and Lower outliers: Q1–1.5*IQR.
Measures of Association indicate how two variables are associated with each other, if at all. The two commonly used approaches for testing this are Chi-Square and Correlation.
We will discuss these approaches of association and graphical methods of descriptive statistics in the upcoming blogs. Keep watching this space for more.
Hope you like the reads. Please share constructive feedback and topics that you would like to read about.
References
https://sciencestruck.com/descriptive-vs-inferential-statistics
https://www.nature.com/articles/6400501/figures/1
https://infograph.venngage.com/templates/infographics/statistical?preview=6dd8cb98-4a89-4a0a-9b65-5ba57eecd0b4
https://en.wikipedia.org/wiki/Normal_distribution
https://www.gs.washington.edu/academics/courses/akey/56008/lecture/lecture2.pdf
https://ia800608.us.archive.org/24/items/IntroductoryStatistics7thEdP.MannWiley2010WW/Introductory%20Statistics%207th%20ed%20-%20P.%20Mann%20%28Wiley%2C%202010%29%20WW.pdf
Latest posts by Yogita Kinha (see all)
- A simple guide to Hypothesis Testing - September 24, 2019
- Accelerate your job search with Word cloud in Python - September 22, 2019
- AI revolution in Healthcare industry - September 8, 2019
Follow us on
Free Data Science & AI Starter Course
