Edvancer's Knowledge Hub
Foundations of data science made simple (Part 1)

Through this series of blog posts, you will gain a solid overview of the fundamental steps involved in almost all data science projects. These basic processes will help you assess the context, as well as constraints, for selecting suitable algorithms to use in a project. There are four key steps in a data science project. First, the data must be processed and prepared for analysis. Next, suitable algorithms are shortlisted based on your project’s requirements. Following which, parameters of the algorithms have to be tuned to optimize results. These finally culminate in the building of models that are then compared to select the best one.
Data preparation
Data science is all about the data. If data quality is poor, even the most sophisticated analysis would generate only lackluster results. In this post, I will cover the basic data format typically used in analysis, as well as methods for data processing to improve results.
Data Format
The tabular form is most commonly used to represent data for analysis (see Table A). Each row indicates a data point representing a single observation, and each column shows a variable describing the data point. Variables are also known as attributes, features, or dimensions.
 Table A. Imaginary dataset of grocery transactions from animals shopping at a supermarket. Each row is a transaction, and each column provides information on the transactions.
Depending on our objective, we could change the type of observations represented in each row. For instance, the representation in Table A allows us to study patterns across a number of transactions. However, if we instead wanted to study transaction patterns across days, we need to represent each row as an aggregate of the day’s transactions. For a more comprehensive analysis, we could also add new variables, such as the day’s weather (see Table B).
Table B. Reformatted dataset showing aggregated daily transactions, with additional variables included.
Variable Types
There are four main types of variables, and it is important to distinguish between them to ensure that they are appropriate for our selected algorithms.
Table A. Imaginary dataset of grocery transactions from animals shopping at a supermarket. Each row is a transaction, and each column provides information on the transactions.
Depending on our objective, we could change the type of observations represented in each row. For instance, the representation in Table A allows us to study patterns across a number of transactions. However, if we instead wanted to study transaction patterns across days, we need to represent each row as an aggregate of the day’s transactions. For a more comprehensive analysis, we could also add new variables, such as the day’s weather (see Table B).
Table B. Reformatted dataset showing aggregated daily transactions, with additional variables included.
Variable Types
There are four main types of variables, and it is important to distinguish between them to ensure that they are appropriate for our selected algorithms.

Share this on
Follow us on
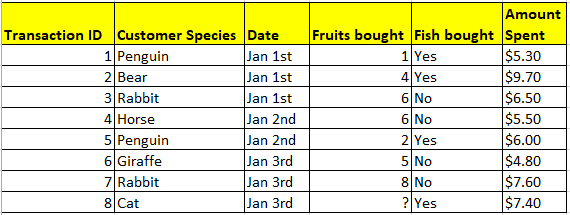 Table A. Imaginary dataset of grocery transactions from animals shopping at a supermarket. Each row is a transaction, and each column provides information on the transactions.
Depending on our objective, we could change the type of observations represented in each row. For instance, the representation in Table A allows us to study patterns across a number of transactions. However, if we instead wanted to study transaction patterns across days, we need to represent each row as an aggregate of the day’s transactions. For a more comprehensive analysis, we could also add new variables, such as the day’s weather (see Table B).
Table A. Imaginary dataset of grocery transactions from animals shopping at a supermarket. Each row is a transaction, and each column provides information on the transactions.
Depending on our objective, we could change the type of observations represented in each row. For instance, the representation in Table A allows us to study patterns across a number of transactions. However, if we instead wanted to study transaction patterns across days, we need to represent each row as an aggregate of the day’s transactions. For a more comprehensive analysis, we could also add new variables, such as the day’s weather (see Table B).
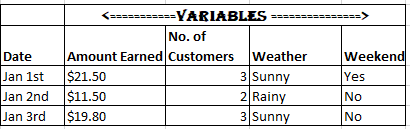 Table B. Reformatted dataset showing aggregated daily transactions, with additional variables included.
Variable Types
There are four main types of variables, and it is important to distinguish between them to ensure that they are appropriate for our selected algorithms.
Table B. Reformatted dataset showing aggregated daily transactions, with additional variables included.
Variable Types
There are four main types of variables, and it is important to distinguish between them to ensure that they are appropriate for our selected algorithms.
- This is the simplest type of variable, with only two possible options. In Table A, a binary variable is used to indicate if customers bought fish.
- When there are more than two options, the information can be represented via a categorical variable. In Table A, a categorical variable is used to describe the customers’ species.
- These are used when the information can be represented as a whole number. In Table A, an integer variable is used to indicate the number of fruits purchased by each customer.
- This is the most detailed variable, representing numbers with decimal places. In Table A, a continuous variable is used to indicate the amount spent by each customer.
- If the missing value is of either the binary or categorical variable type, it could be replaced with the mode (i.e. the most common value) of that variable. For integers or continuous values, the median could be used. Applying this method to Table A would allow us to estimate that the cat bought five fruits, as that was the median number of fruits purchased in the other seven transactions.
- Missing values could also be computed using more advanced algorithms under supervised learning (to be covered in the next section). While more time-consuming, computed estimates tend to be more accurate because the algorithms estimate missing values based on similar transactions, unlike the approximation method that reviews every transaction. From Table A, we can observe that customers who bought fish tended to purchase fewer fruits, and hence estimate that the cat only bought about two or three fruits.
- As a last resort, rows with missing values could be removed. However, this is generally avoided as it reduces the amount of data available for analysis. Moreover, excluding data points could cause the resulting data sample to be skewed toward or away from particular groups. For instance, cats might be less willing to disclose the number of fruits they purchase, and if we removed customers with unrecorded fruit transactions, cats would then be under-represented in our final sample.
Manu Jeevan
Manu Jeevan is a self-taught data scientist and loves to explain data science concepts in simple terms. You can connect with him on LinkedIn, or email him at manu@bigdataexaminer.com.
Latest posts by Manu Jeevan (see all)
- Python IDEs for Data Science: Top 5 - January 19, 2019
- The 5 exciting machine learning, data science and big data trends for 2019 - January 19, 2019
- A/B Testing Made Simple – Part 2 - October 30, 2018
Follow us on
Free Data Science & AI Starter Course
