Edvancer's Knowledge Hub
Foundations of data science made simple (Part 2)

In my previous post, I discussed on how to prepare data for your data science project. In this post, I will discuss over ten different algorithms that can be used to analyse data. The choice of algorithm depends on the type of task we wish to perform, of which there are three main categories.
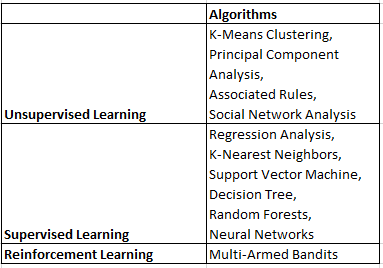
Table 1 lists the algorithms which will be discussed in this post, as well as their associated categories.
 -Table 1
Unsupervised Learning
Task: Tell me what patterns exists in my data.
When we want to find hidden patterns in our dataset, we could use unsupervised learning algorithms. These algorithms are unsupervised because we do not know what patterns to look out for and thus leave them to be uncovered by the algorithm.
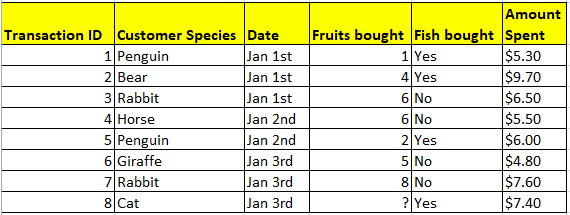
 Table A. Imaginary dataset of grocery transactions from animals shopping at a supermarket. Each row is a transaction, and each column provides information on the transactions.
In Table A, an unsupervised model could learn which items were frequently bought together, or it could cluster customers based on their purchases. We could validate results from an unsupervised model via indirect means, such as checking if customer clusters generated correspond to familiar categories (e.g. herbivores and carnivores).
Supervised Learning
Task: Use the patterns in my data to make predictions.
When we want to make predictions, supervised learning algorithms could be used. These algorithms are supervised because we want them to base their predictions on pre-existing patterns. In Table A, a supervised model could learn to forecast the number of fruits a customer would purchase (prediction) based on its species and whether it bought fish (predictor variables).
We can directly assess the accuracy of a supervised model by inputting values for species and fish purchase for future customers, and then checking how close the model’s predictions are to the actual numbers of fruits bought.
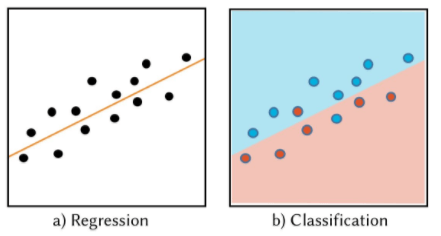
When we predict integers or continuous values, such as the number of fruits purchased, we would be solving a regression problem (see Figure 1a). When we predict binary or categorical values, such as whether it would rain or not, we would be solving a classification problem (see Figure 1b). Nonetheless, most classification algorithms are also able to generate predictions as a continuous probability value, such as in statements like “there is a 75% chance of rain”, which allows for predictions of higher precision.
 Regression solves deriving a trend line, while classification involves categorizing data points into groups. Please note that errors would be expected in both tasks. In regression, data points might stray from the trend line, while in classification, data points might fall into wrong categories.
Reinforcement learning
Task: Use the patterns in my data to make predictions, and improve these predictions as more results come in.
Unlike unsupervised and supervised learning, where models are learned and then deployed without further changes, a reinforcement learning model continuously improves itself using feedback from results.
Moving away from Table A to a real-life example: imagine we are comparing the effectiveness of two online ads. We could initially display each ad equally often, assessing the number of people who clicked on each ad. A reinforcement learning model would then take this number as feedback on the ad’s popularity, using it to tweak the display to favor the more popular ad. Through this iterative process, the model could eventually learn to display the better ad exclusively.
Other Considerations
Besides the main tasks they perform, algorithms also differ in other aspects, such as their ability to analyze different data types, as well as the nature of results they generate.
Parameter Tuning
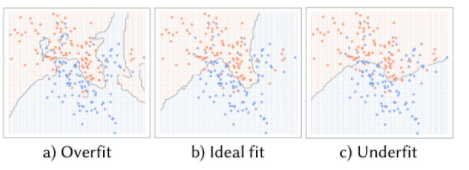
The numerous algorithms available in data science naturally translate to a vast number of potential models we could build—but even a single algorithm can generate varying results, depending on how its parameters are tuned. Parameters are options used to tweak an algorithm’s settings, much like tuning a radio for the right frequency channel. Different algorithms have different parameters available for tuning. Needless to say, a model’s accuracy suffers when its parameters are not suitably tuned. Take a look at Figure 2 to observe how one classification algorithm could generate multiple boundaries to distinguish between orange and blue points.
 Figure 2. Comparison of prediction results from the same algorithm fitted with different parameters.
In Figure 2a, the algorithm was overly-sensitive and mistook random variations in the data as persistent patterns. This problem is known as overfitting. An overfitted model would yield highly accurate predictions for the current data, but would be less generalizable to future data.
In Figure 2C, on the other hand, the algorithm was too insensitive, and overlooked underlying patterns.
This problem is known as underfitting. An underfitted model is likely to neglect significant trends, which would cause it to yield less accurate predictions for both current and future data.
But when parameters are tuned just right, such as shown in Figure 2b, the algorithm strikes a balance between identifying major trends and discounting minor variations, rendering the resulting model well-suited for making predictions.
For most studies, overfitting is a constant concern. In seeking to minimize prediction errors, we may be tempted to increase the complexity of our prediction model, which eventually leads to results like those in Figure 2a—prediction boundaries that are intricate but superfluous.
One way to keep a model’s overall complexity in check is to introduce a penalty parameter, in a step known as regularization. This new parameter penalizes any increase in a model’s complexity by artificially inflating prediction error, thus enabling the algorithm to account for both complexity and accuracy in optimizing its original parameters. By keeping a model simple, we help to maintain its generalizability.
In the next blog post, I will talk about how to evaluate the results of an data science project. So, stay tuned!!
Share this on


Follow us on


 -Table 1
Unsupervised Learning
Task: Tell me what patterns exists in my data.
When we want to find hidden patterns in our dataset, we could use unsupervised learning algorithms. These algorithms are unsupervised because we do not know what patterns to look out for and thus leave them to be uncovered by the algorithm.
 Table A. Imaginary dataset of grocery transactions from animals shopping at a supermarket. Each row is a transaction, and each column provides information on the transactions.
In Table A, an unsupervised model could learn which items were frequently bought together, or it could cluster customers based on their purchases. We could validate results from an unsupervised model via indirect means, such as checking if customer clusters generated correspond to familiar categories (e.g. herbivores and carnivores).
Supervised Learning
Task: Use the patterns in my data to make predictions.
When we want to make predictions, supervised learning algorithms could be used. These algorithms are supervised because we want them to base their predictions on pre-existing patterns. In Table A, a supervised model could learn to forecast the number of fruits a customer would purchase (prediction) based on its species and whether it bought fish (predictor variables).
We can directly assess the accuracy of a supervised model by inputting values for species and fish purchase for future customers, and then checking how close the model’s predictions are to the actual numbers of fruits bought.
When we predict integers or continuous values, such as the number of fruits purchased, we would be solving a regression problem (see Figure 1a). When we predict binary or categorical values, such as whether it would rain or not, we would be solving a classification problem (see Figure 1b). Nonetheless, most classification algorithms are also able to generate predictions as a continuous probability value, such as in statements like “there is a 75% chance of rain”, which allows for predictions of higher precision.
 Regression solves deriving a trend line, while classification involves categorizing data points into groups. Please note that errors would be expected in both tasks. In regression, data points might stray from the trend line, while in classification, data points might fall into wrong categories.
Reinforcement learning
Task: Use the patterns in my data to make predictions, and improve these predictions as more results come in.
Unlike unsupervised and supervised learning, where models are learned and then deployed without further changes, a reinforcement learning model continuously improves itself using feedback from results.
Moving away from Table A to a real-life example: imagine we are comparing the effectiveness of two online ads. We could initially display each ad equally often, assessing the number of people who clicked on each ad. A reinforcement learning model would then take this number as feedback on the ad’s popularity, using it to tweak the display to favor the more popular ad. Through this iterative process, the model could eventually learn to display the better ad exclusively.
Other Considerations
Besides the main tasks they perform, algorithms also differ in other aspects, such as their ability to analyze different data types, as well as the nature of results they generate.
Parameter Tuning
The numerous algorithms available in data science naturally translate to a vast number of potential models we could build—but even a single algorithm can generate varying results, depending on how its parameters are tuned. Parameters are options used to tweak an algorithm’s settings, much like tuning a radio for the right frequency channel. Different algorithms have different parameters available for tuning. Needless to say, a model’s accuracy suffers when its parameters are not suitably tuned. Take a look at Figure 2 to observe how one classification algorithm could generate multiple boundaries to distinguish between orange and blue points.
 Figure 2. Comparison of prediction results from the same algorithm fitted with different parameters.
In Figure 2a, the algorithm was overly-sensitive and mistook random variations in the data as persistent patterns. This problem is known as overfitting. An overfitted model would yield highly accurate predictions for the current data, but would be less generalizable to future data.
In Figure 2C, on the other hand, the algorithm was too insensitive, and overlooked underlying patterns.
This problem is known as underfitting. An underfitted model is likely to neglect significant trends, which would cause it to yield less accurate predictions for both current and future data.
But when parameters are tuned just right, such as shown in Figure 2b, the algorithm strikes a balance between identifying major trends and discounting minor variations, rendering the resulting model well-suited for making predictions.
For most studies, overfitting is a constant concern. In seeking to minimize prediction errors, we may be tempted to increase the complexity of our prediction model, which eventually leads to results like those in Figure 2a—prediction boundaries that are intricate but superfluous.
One way to keep a model’s overall complexity in check is to introduce a penalty parameter, in a step known as regularization. This new parameter penalizes any increase in a model’s complexity by artificially inflating prediction error, thus enabling the algorithm to account for both complexity and accuracy in optimizing its original parameters. By keeping a model simple, we help to maintain its generalizability.
In the next blog post, I will talk about how to evaluate the results of an data science project. So, stay tuned!!
Manu Jeevan
Manu Jeevan is a self-taught data scientist and loves to explain data science concepts in simple terms. You can connect with him on LinkedIn, or email him at manu@bigdataexaminer.com.
Latest posts by Manu Jeevan (see all)
- Python IDEs for Data Science: Top 5 - January 19, 2019
- The 5 exciting machine learning, data science and big data trends for 2019 - January 19, 2019
- A/B Testing Made Simple – Part 2 - October 30, 2018
Follow us on
Free Data Science & AI Starter Course

