Edvancer's Knowledge Hub
How to approach a data science problem (part 1)

In this blog post, I have examined a simple approach and methodology for developing analytics solutions. During my initial days of analyzing data, I used many spreadsheets, but did not follow a good methodology to approach problems. There’s only so much that you can sort, filter, pivot, and script when working with a single data set in a spreadsheet. You can spend extensive time diving into the data, slicing and dicing, pivoting one way or the other, only to find that the best you can do is show the biggest and the smallest data points. You don’t gain any real insights. The sheets full of data that you end up with are a lot more interesting for you than they are for the managers you share them with.
Analytics solutions look at data to unveil stories about current and future happenings. To be effective in a data science role, you must improve your storytelling game. The same results can be shown in different ways, and sometimes in many different ways. Your success depends on making the audience see what YOU are seeing.
People have biases that influence how they receive your results. You need to find a way to make your results relevant to each of them—or at least make the results relevant to the stakeholders. You primarily need to carry out two tasks. The first is to find a way to make your findings interesting for non-technical people. This can be done via statistics, top-n reporting, a good storyline, and visualization. I call this the “BI/BA of analytics,” or the simple descriptive analytics. Business intelligence (BI)/business analytics (BA) dashboards are a useful form of data presentation, but they characteristically rely on the viewer to find insights.
This has value and some amount of usefulness, but usually are limited to cool visualizations that I call “Sesame Street Analytics.”
The PBS show, Sesame Street, used to have a segment that taught children to recognize differences in images. It had the musical tagline “One of these things is not like the others.” Visualizations with anomalies identified in contrasting colors helped the audience immediately see how “one of these things is not like the others”. You do not need a story if you are able to show this properly. People simply look at your visualization and understand what you are trying to convey.
Your second task is to make the data interesting to your peers, the technical people, and your new data science friends. You can do this with models and analytics. Your visualizing and storytelling must be at a completely new, greater level. If you only present “Sesame Street Analytics” to a technical audience, you can expect to hear “That’s just visualization; I want to know why it is an outlier.” You need to do more to impress this audience, using real algorithms and analytics.
This blog post sets you on the track towards impressing both audiences.
Analytics methodology and approach
One of the key factors that determines how successful your solution will be in solving an analytics problem is how you approach it. In the case of analytics problems, you can use two broad approaches, or methodologies, to get to insightful solutions. Based on your background, you will have some pre-determined disposition in terms of how you want to approach problems. The ultimate goal is to convert data into value for your company. You get to that value by finding insights that solve technical or business problems. The two broad approaches, shown in Figure 1, are the “explore the data” approach, and the “solve the business problem” approach.
 Figure 1: The two approaches to developing analytics solutions
These are the two main approaches that I use, and you will find literature about many granular, systematic methodologies that support some variation of each of these approaches. Most of the analytics literature guides you to the problem-centric approach. If you are strongly aware of the data that you have but not sure how to use it to solve problems, you may find yourself starting in the statistically centered exploratory data analysis (EDA) space that is most closely associated with statistician John Tukey. This approach frequently has some quick wins along the way in finding statistical value in the data rollups and visualizations used to explore the data.
Most domain data experts favor starting with EDA because it helps you understand the data and get the quick wins that allow you to pacify the stakeholders while you get into the more time-consuming part of the analysis. Your stakeholders often have hypotheses (and some biases) related to the data. Early findings from this side often sound like “You can see that issue X is highly correlated with condition Y in the environment; hence, you should address condition Y to reduce the number of times you see issue X.”
Figure 2 shows how to look at these processes as a comparison. There is no right or wrong side to start on; depending on your analysis goals, either direction or approach is viable. Note that this model comprises of data acquisition, data transport, data storage, sharing, or streaming, and secure access to that data, all of which you must consider if the model is to be implemented on a production data flow—or “operationalized.” The previous, simpler model that shows a simple data and data science combination (refer to figure 1) still applies for exploring a static data set or stream that you can play back and analyze using offline tools.
Figure 2: Exploratory Data Versus Problem Approach Comparison
Common Approach Walkthrough
Though it is a common belief that analytics is done only by math PhDs and statisticians, general analysts and industry subject matter experts (SMEs) now routinely use software to explore, predict, and preempt business and technical problems in their respective areas of expertise. You and other “citizen data scientists” have a variety of software packages at your disposal today to enable you to find interesting insights and build useful models.
You can start from either side when you understand the validity of both approaches. The important thing to remember is that many of the people you work with might be starting at the other end of the spectrum. You need to be aware of this as you start sharing your insights with a wider audience. When either audience asks, “What problem does this solve for us?” you can present the relevant findings in the relevant manner.
Figure 1: The two approaches to developing analytics solutions
These are the two main approaches that I use, and you will find literature about many granular, systematic methodologies that support some variation of each of these approaches. Most of the analytics literature guides you to the problem-centric approach. If you are strongly aware of the data that you have but not sure how to use it to solve problems, you may find yourself starting in the statistically centered exploratory data analysis (EDA) space that is most closely associated with statistician John Tukey. This approach frequently has some quick wins along the way in finding statistical value in the data rollups and visualizations used to explore the data.
Most domain data experts favor starting with EDA because it helps you understand the data and get the quick wins that allow you to pacify the stakeholders while you get into the more time-consuming part of the analysis. Your stakeholders often have hypotheses (and some biases) related to the data. Early findings from this side often sound like “You can see that issue X is highly correlated with condition Y in the environment; hence, you should address condition Y to reduce the number of times you see issue X.”
Figure 2 shows how to look at these processes as a comparison. There is no right or wrong side to start on; depending on your analysis goals, either direction or approach is viable. Note that this model comprises of data acquisition, data transport, data storage, sharing, or streaming, and secure access to that data, all of which you must consider if the model is to be implemented on a production data flow—or “operationalized.” The previous, simpler model that shows a simple data and data science combination (refer to figure 1) still applies for exploring a static data set or stream that you can play back and analyze using offline tools.
Figure 2: Exploratory Data Versus Problem Approach Comparison
Common Approach Walkthrough
Though it is a common belief that analytics is done only by math PhDs and statisticians, general analysts and industry subject matter experts (SMEs) now routinely use software to explore, predict, and preempt business and technical problems in their respective areas of expertise. You and other “citizen data scientists” have a variety of software packages at your disposal today to enable you to find interesting insights and build useful models.
You can start from either side when you understand the validity of both approaches. The important thing to remember is that many of the people you work with might be starting at the other end of the spectrum. You need to be aware of this as you start sharing your insights with a wider audience. When either audience asks, “What problem does this solve for us?” you can present the relevant findings in the relevant manner.

Share this on
Follow us on
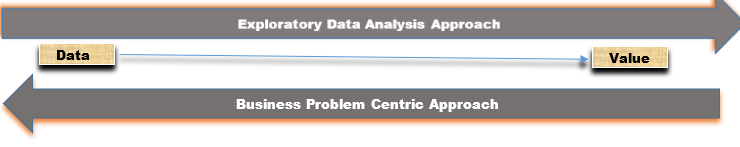 Figure 1: The two approaches to developing analytics solutions
These are the two main approaches that I use, and you will find literature about many granular, systematic methodologies that support some variation of each of these approaches. Most of the analytics literature guides you to the problem-centric approach. If you are strongly aware of the data that you have but not sure how to use it to solve problems, you may find yourself starting in the statistically centered exploratory data analysis (EDA) space that is most closely associated with statistician John Tukey. This approach frequently has some quick wins along the way in finding statistical value in the data rollups and visualizations used to explore the data.
Most domain data experts favor starting with EDA because it helps you understand the data and get the quick wins that allow you to pacify the stakeholders while you get into the more time-consuming part of the analysis. Your stakeholders often have hypotheses (and some biases) related to the data. Early findings from this side often sound like “You can see that issue X is highly correlated with condition Y in the environment; hence, you should address condition Y to reduce the number of times you see issue X.”
Figure 2 shows how to look at these processes as a comparison. There is no right or wrong side to start on; depending on your analysis goals, either direction or approach is viable. Note that this model comprises of data acquisition, data transport, data storage, sharing, or streaming, and secure access to that data, all of which you must consider if the model is to be implemented on a production data flow—or “operationalized.” The previous, simpler model that shows a simple data and data science combination (refer to figure 1) still applies for exploring a static data set or stream that you can play back and analyze using offline tools.
Figure 1: The two approaches to developing analytics solutions
These are the two main approaches that I use, and you will find literature about many granular, systematic methodologies that support some variation of each of these approaches. Most of the analytics literature guides you to the problem-centric approach. If you are strongly aware of the data that you have but not sure how to use it to solve problems, you may find yourself starting in the statistically centered exploratory data analysis (EDA) space that is most closely associated with statistician John Tukey. This approach frequently has some quick wins along the way in finding statistical value in the data rollups and visualizations used to explore the data.
Most domain data experts favor starting with EDA because it helps you understand the data and get the quick wins that allow you to pacify the stakeholders while you get into the more time-consuming part of the analysis. Your stakeholders often have hypotheses (and some biases) related to the data. Early findings from this side often sound like “You can see that issue X is highly correlated with condition Y in the environment; hence, you should address condition Y to reduce the number of times you see issue X.”
Figure 2 shows how to look at these processes as a comparison. There is no right or wrong side to start on; depending on your analysis goals, either direction or approach is viable. Note that this model comprises of data acquisition, data transport, data storage, sharing, or streaming, and secure access to that data, all of which you must consider if the model is to be implemented on a production data flow—or “operationalized.” The previous, simpler model that shows a simple data and data science combination (refer to figure 1) still applies for exploring a static data set or stream that you can play back and analyze using offline tools.
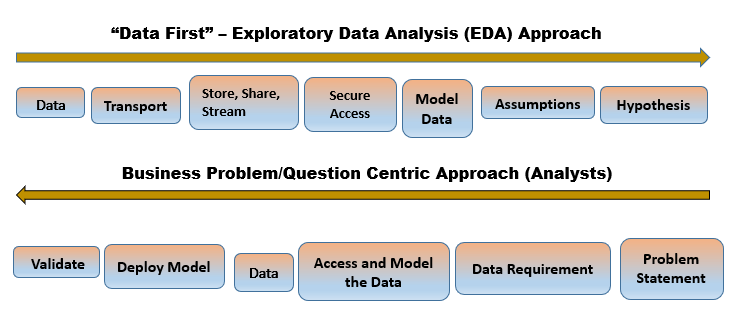 Figure 2: Exploratory Data Versus Problem Approach Comparison
Common Approach Walkthrough
Though it is a common belief that analytics is done only by math PhDs and statisticians, general analysts and industry subject matter experts (SMEs) now routinely use software to explore, predict, and preempt business and technical problems in their respective areas of expertise. You and other “citizen data scientists” have a variety of software packages at your disposal today to enable you to find interesting insights and build useful models.
You can start from either side when you understand the validity of both approaches. The important thing to remember is that many of the people you work with might be starting at the other end of the spectrum. You need to be aware of this as you start sharing your insights with a wider audience. When either audience asks, “What problem does this solve for us?” you can present the relevant findings in the relevant manner.
Figure 2: Exploratory Data Versus Problem Approach Comparison
Common Approach Walkthrough
Though it is a common belief that analytics is done only by math PhDs and statisticians, general analysts and industry subject matter experts (SMEs) now routinely use software to explore, predict, and preempt business and technical problems in their respective areas of expertise. You and other “citizen data scientists” have a variety of software packages at your disposal today to enable you to find interesting insights and build useful models.
You can start from either side when you understand the validity of both approaches. The important thing to remember is that many of the people you work with might be starting at the other end of the spectrum. You need to be aware of this as you start sharing your insights with a wider audience. When either audience asks, “What problem does this solve for us?” you can present the relevant findings in the relevant manner.
Manu Jeevan
Manu Jeevan is a self-taught data scientist and loves to explain data science concepts in simple terms. You can connect with him on LinkedIn, or email him at manu@bigdataexaminer.com.
Latest posts by Manu Jeevan (see all)
- Python IDEs for Data Science: Top 5 - January 19, 2019
- The 5 exciting machine learning, data science and big data trends for 2019 - January 19, 2019
- A/B Testing Made Simple – Part 2 - October 30, 2018
Follow us on
Free Data Science & AI Starter Course
