Edvancer's Knowledge Hub
Python for Data Science Made Simple: A Step-by-Step Guide
Python is a versatile programming language that’s been widely adopted across the data science sector over the last decade. In fact, Python is the second most popular programming language in data science, next to R.
The main purpose of this blog post is to show you how easy it is to learn data science using Python. You might assume that you need to be an advanced Python programmer to perform the complex tasks normally associated with data science, but that’s far from the truth. Python comes with a host of useful libraries that do all the heavy lifting for you in the background. You don’t even realize how much is going on, and you don’t need to care. All you really need to know is that you want to perform specific tasks and that Python makes these tasks quite accessible.
So, let’s get started.
Setting up Python for data science
Whether you’re on the Mac or a Windows PC, I recommend downloading a free Python distribution that gives you easy access to as many useful modules as possible.
I’ve tried several distributions, and the one I recommend is Anaconda by Continuum Analytics. This Python distribution has more than 200 packages. To understand the difference between a package, module, library in Python, read this blog post.
When you download Anaconda Python distribution, you have a choice between downloading version 2 or version 3. I highly recommend you to use version Python 2.17.12. As of late 2016, that version is being used by the vast majority of non-computer science Python users. It performs great for data science, it’s easier to learn than Python 3, and sites like GitHub have millions of snippets and scripts that you can copy to make your life easier.
Anaconda also comes with Ipython programming environment, which suggest you to use. To open IPython in your web browser, after installing Anaconda, just navigate to and open the Juptyer Notebook program. That program automatically launches the web‐browser application
 You should read this Stackoverflow thread to learn how to change directories in Ipython Notebook.
Learn the Fundamentals
You must learn the fundamentals of Python before you delve into its data science libraries. Python is an object-oriented programming language. In Python, an object is everything that can be assigned to a variable or that can be passed as an argument to a function. The following are all considered objects in Python: Numbers, Strings, Lists, Tuples, Sets, Dictionaries, Functions, Classes.
In Python, a function does basically the same thing as it does in plain math — it accepts data inputs, processes them, and outputs the result. Output results depend wholly on what the function was programmed to do. Classes, on the other hand, are prototypes of objects that are designed to output additional objects.
If your goal is to write fast, reusable, easy‐to‐modify code in Python, then you must utilize functions and classes. Using functions and classes helps to keep your code efficient and organized.
Now, let’s see the different data science libraries available in Python.
Scientific Computing: Numpy and SciPy
NumPy is the Python package that primarily focuses on working with n‐dimensional array objects, and SciPy is a collection of mathematical algorithms and sophisticated functions that extends the capabilities of the NumPy library. Scipy library adds some specialized scientific functions to Python for more specific tasks in data science.
To enable Numpy in Python(or any library), you must first import the library.
 np.array(scores) converts a list into an array.
When working with plain Python — a Python without any external extensions (such as libraries) added to it — you’re confined to storing your data in one‐dimensional lists. But if you extend Python by using the NumPy library, you’re provided a basis from which you can work with n‐dimensional arrays. (Just in case you were wondering, n‐dimensional arrays are arrays of one or multiple dimensions).
First, start learning NumPy as it is the fundamental package for scientific computing with Python. A good understanding of Numpy will help you use libraries like Pandas and Scipy effectively.
Data Wrangling: Pandas
Pandas is the most widely used tool for data munging. It contains high-level data structures and manipulation tools designed to make data analysis fast and easy. For users of the R language for statistical computing, the DataFrame name will be familiar.
Pandas is one of the critical ingredients enabling Python to be a powerful and productive data analysis environment.
I will show you how to work with Pandas using a simple dataset.
 Data frame is a spread sheet like structure, containing ordered collection of columns. Each column can have different value type. Data frame has both row index and column index.
 Visualization: Matplotlib + Seaborn + Bokeh
Matlplotlib is a Python module for visualization. Matplotlib allows you to easily make line graphs, pie chart, histogram and other professional grade figures.
Using Matplotlib you can customize every aspect of a figure. When used within IPython, Matplotlib has interactive features like zooming and panning. It supports different GUI back ends on all operating systems, and can also export graphics to common vector and graphics formats: PDF, SVG, JPG, PNG, BMP, GIF, etc.
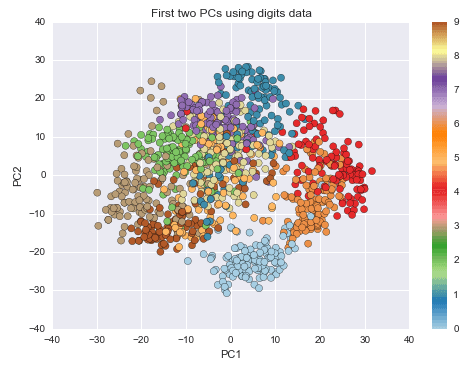
 Seaborn is a data visualization library based on Matplotlib for creating attractive and informative statistical graphs in Python. The main idea of Seaborn is that it can create complicated plot types from Pandas data with relatively simple commands. I used Seaborn to create this image:
 Machine Learning: Scikit-learn
The goal of machine learning is to teach machines(Softwares) to carry out tasks by providing them with a couple of examples(how to do or not to do a task).
There are lots of machine learning libraries in Python, but, Scikit-learn is the most popular one. It’s also built on top of Numpy, Scipy and Matplotlib libraries. You can implement almost all machine learning techniques like regression, clustering, classification, etc. using this library. So, if you are planning to learn machine learning using Python, then I would suggest you to start with Scikit-learn.
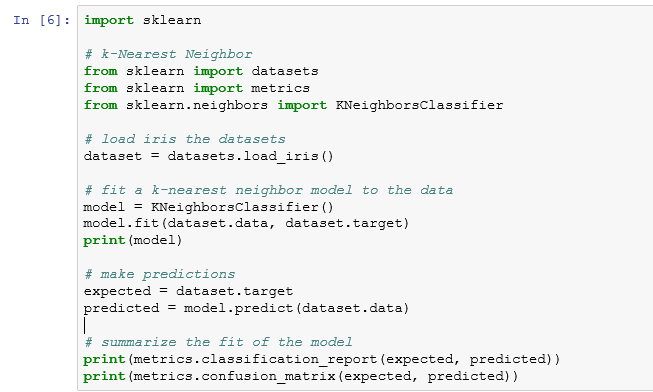
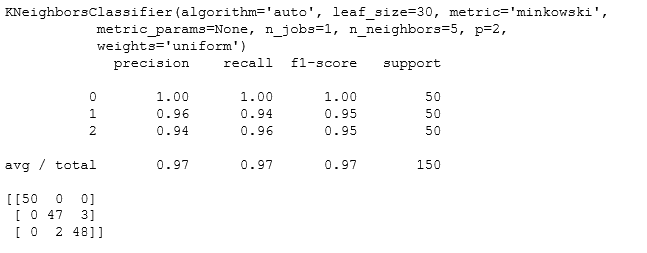
The K-Nearest Neighbor algorithm can be used for classification or regression. This recipe shows the use of kNN model to make predictions for the iris dataset.

 Some of the other Machine Learning libraries are:
Statistics: Statsmodels and Scipy.stats
Statsmodels and Scipy.stats are two popular statistical modules in Python. Scipy.stats is mainly used to implement probability distributions. Statsmodels, on the other hand, provides statistical models with a formula framework similar to R. An extensive list of descriptive statistics, statistical tests, plotting functions, and result statistics are available for different types of data and each estimator.
Here’s how you run a normal distribution using Scipy.stats module.

 The normal distribution is a continuous distribution or a function that can take on values anywhere on the real line. The normal distribution is parameterized by two parameters: the mean of the distribution μ and the variance σ2.
Web scrapping: Requests, Scrapy and beautifulSoup
Web scraping means getting unstructured data from the web, typically in an HTML format, transforming it into a structure format that can be analysed.
The following are the popular libraries for web scraping:
 What beautiful = urllib2.urlopen(url).read() does is, it goes to bigdataexaminer.com and gets the whole html text on bigdataexaminer.com . I then store it in a variable called beautiful.
I am using urllib2 to fetch the url “http://www.bigdataexaminer.com/” , you can also use Requests to do the same. To understand the difference between urllib2 and requests, read this Stackoverflow thread.
Scrapy is also similar to BeautifulSoup. Prasanna Venkadesh, a backend engineer, explained the difference between these two libraries on Quora:
“ Scrapy is a Web-spider or web scraper framework, You give Scrapy a root URL to start crawling, then you can specify constraints on how many number of Urls you want to crawl and fetch,etc., It is a complete framework for Web-scrapping or crawling.
While
Beautiful Soup is a parsing library which also does pretty job of fetching contents from Url and allows you to parse certain parts of them without any hassle. It only fetches the contents of the URL that you give and stops. It does not crawl unless you manually put it inside a infinite loop with certain criteria.
In simple words, with Beautiful Soup you can build something similar to Scrapy.
Beautiful Soup is a library while Scrapy is a complete framework. “
Conclusion:
Now, you know what the basics of Python and what these libraries do. It’s time to solve data analytics problems using the knowledge you have gained. You need to first work with a structured data set and then you can solve complicated unstructured data analytics problems.
Share this on


Follow us on


 You should read this Stackoverflow thread to learn how to change directories in Ipython Notebook.
Learn the Fundamentals
You must learn the fundamentals of Python before you delve into its data science libraries. Python is an object-oriented programming language. In Python, an object is everything that can be assigned to a variable or that can be passed as an argument to a function. The following are all considered objects in Python: Numbers, Strings, Lists, Tuples, Sets, Dictionaries, Functions, Classes.
In Python, a function does basically the same thing as it does in plain math — it accepts data inputs, processes them, and outputs the result. Output results depend wholly on what the function was programmed to do. Classes, on the other hand, are prototypes of objects that are designed to output additional objects.
If your goal is to write fast, reusable, easy‐to‐modify code in Python, then you must utilize functions and classes. Using functions and classes helps to keep your code efficient and organized.
Now, let’s see the different data science libraries available in Python.
Scientific Computing: Numpy and SciPy
NumPy is the Python package that primarily focuses on working with n‐dimensional array objects, and SciPy is a collection of mathematical algorithms and sophisticated functions that extends the capabilities of the NumPy library. Scipy library adds some specialized scientific functions to Python for more specific tasks in data science.
To enable Numpy in Python(or any library), you must first import the library.
 np.array(scores) converts a list into an array.
When working with plain Python — a Python without any external extensions (such as libraries) added to it — you’re confined to storing your data in one‐dimensional lists. But if you extend Python by using the NumPy library, you’re provided a basis from which you can work with n‐dimensional arrays. (Just in case you were wondering, n‐dimensional arrays are arrays of one or multiple dimensions).
First, start learning NumPy as it is the fundamental package for scientific computing with Python. A good understanding of Numpy will help you use libraries like Pandas and Scipy effectively.
Data Wrangling: Pandas
Pandas is the most widely used tool for data munging. It contains high-level data structures and manipulation tools designed to make data analysis fast and easy. For users of the R language for statistical computing, the DataFrame name will be familiar.
Pandas is one of the critical ingredients enabling Python to be a powerful and productive data analysis environment.
I will show you how to work with Pandas using a simple dataset.
 Visualization: Matplotlib + Seaborn + Bokeh
Matlplotlib is a Python module for visualization. Matplotlib allows you to easily make line graphs, pie chart, histogram and other professional grade figures.
Using Matplotlib you can customize every aspect of a figure. When used within IPython, Matplotlib has interactive features like zooming and panning. It supports different GUI back ends on all operating systems, and can also export graphics to common vector and graphics formats: PDF, SVG, JPG, PNG, BMP, GIF, etc.
 Seaborn is a data visualization library based on Matplotlib for creating attractive and informative statistical graphs in Python. The main idea of Seaborn is that it can create complicated plot types from Pandas data with relatively simple commands. I used Seaborn to create this image:
 Machine Learning: Scikit-learn
The goal of machine learning is to teach machines(Softwares) to carry out tasks by providing them with a couple of examples(how to do or not to do a task).
There are lots of machine learning libraries in Python, but, Scikit-learn is the most popular one. It’s also built on top of Numpy, Scipy and Matplotlib libraries. You can implement almost all machine learning techniques like regression, clustering, classification, etc. using this library. So, if you are planning to learn machine learning using Python, then I would suggest you to start with Scikit-learn.
The K-Nearest Neighbor algorithm can be used for classification or regression. This recipe shows the use of kNN model to make predictions for the iris dataset.
 Some of the other Machine Learning libraries are:
Statistics: Statsmodels and Scipy.stats
Statsmodels and Scipy.stats are two popular statistical modules in Python. Scipy.stats is mainly used to implement probability distributions. Statsmodels, on the other hand, provides statistical models with a formula framework similar to R. An extensive list of descriptive statistics, statistical tests, plotting functions, and result statistics are available for different types of data and each estimator.
Here’s how you run a normal distribution using Scipy.stats module.
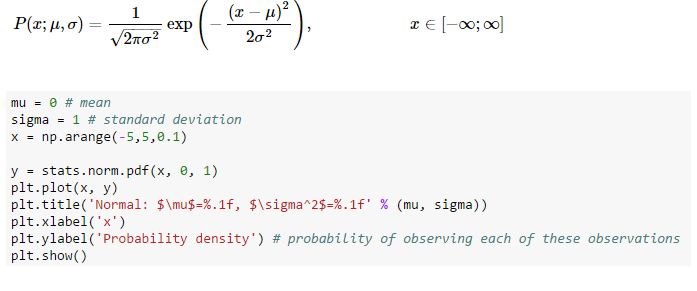
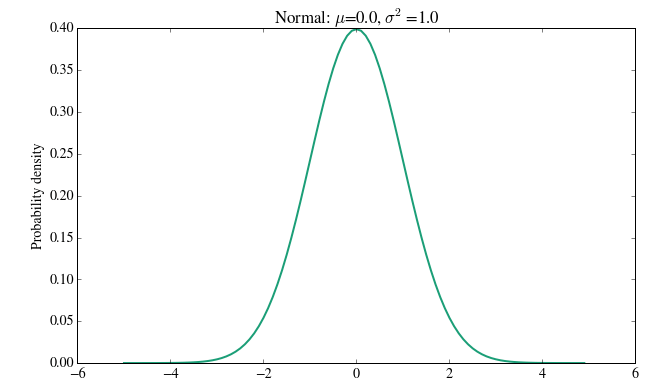 The normal distribution is a continuous distribution or a function that can take on values anywhere on the real line. The normal distribution is parameterized by two parameters: the mean of the distribution μ and the variance σ2.
Web scrapping: Requests, Scrapy and beautifulSoup
Web scraping means getting unstructured data from the web, typically in an HTML format, transforming it into a structure format that can be analysed.
The following are the popular libraries for web scraping:
- Scrapy
- URl lib
- Beautifulsoup
- Requests
 What beautiful = urllib2.urlopen(url).read() does is, it goes to bigdataexaminer.com and gets the whole html text on bigdataexaminer.com . I then store it in a variable called beautiful.
I am using urllib2 to fetch the url “http://www.bigdataexaminer.com/” , you can also use Requests to do the same. To understand the difference between urllib2 and requests, read this Stackoverflow thread.
Scrapy is also similar to BeautifulSoup. Prasanna Venkadesh, a backend engineer, explained the difference between these two libraries on Quora:
“ Scrapy is a Web-spider or web scraper framework, You give Scrapy a root URL to start crawling, then you can specify constraints on how many number of Urls you want to crawl and fetch,etc., It is a complete framework for Web-scrapping or crawling.
While
Beautiful Soup is a parsing library which also does pretty job of fetching contents from Url and allows you to parse certain parts of them without any hassle. It only fetches the contents of the URL that you give and stops. It does not crawl unless you manually put it inside a infinite loop with certain criteria.
In simple words, with Beautiful Soup you can build something similar to Scrapy.
Beautiful Soup is a library while Scrapy is a complete framework. “
Conclusion:
Now, you know what the basics of Python and what these libraries do. It’s time to solve data analytics problems using the knowledge you have gained. You need to first work with a structured data set and then you can solve complicated unstructured data analytics problems.
Manu Jeevan
Manu Jeevan is a self-taught data scientist and loves to explain data science concepts in simple terms. You can connect with him on LinkedIn, or email him at manu@bigdataexaminer.com.
Latest posts by Manu Jeevan (see all)
- Python IDEs for Data Science: Top 5 - January 19, 2019
- The 5 exciting machine learning, data science and big data trends for 2019 - January 19, 2019
- A/B Testing Made Simple – Part 2 - October 30, 2018
Follow us on
Free Data Science & AI Starter Course

